top
おさだのホームページ

matplotlibのアニメーションで複数のグラフを重ねて描画する方法について
matplotlibでアニメーションを作成するaminationモジュールについてネット記事を読み漁っていた際、「matplotlib.animationでは複数のグラフを重ねて描画できない」との意見が多数見受けられた。 しかし、方法さえわかれば可能であるので今回はそれを紹介しようと思う。

1. 一つのグラフの描画

まずは y = sin(x+t) のグラフをアニメーションにして描画し、それにコードを加筆していく形で紹介する。

copy
plot_anime.py
import numpy as np
import matplotlib.pyplot as plt
import matplotlib.animation as animation

fig = plt.figure(figsize=(8, 5))
ax = fig.add_subplot(111)

lim = 50
xs = np.linspace(0, 4*np.pi, 100)
images = []

for i in range(lim):
    theta = i*2*np.pi/lim
    ys = np.sin(xs+theta)
    image = ax.plot(xs, ys, c="#11cccc")

    images.append(image)

anime = animation.ArtistAnimation(fig, images, interval=40, blit=True, repeat_delay=0)
anime.save("sin.gif", writer="pillow")
plt.show()


実行結果:
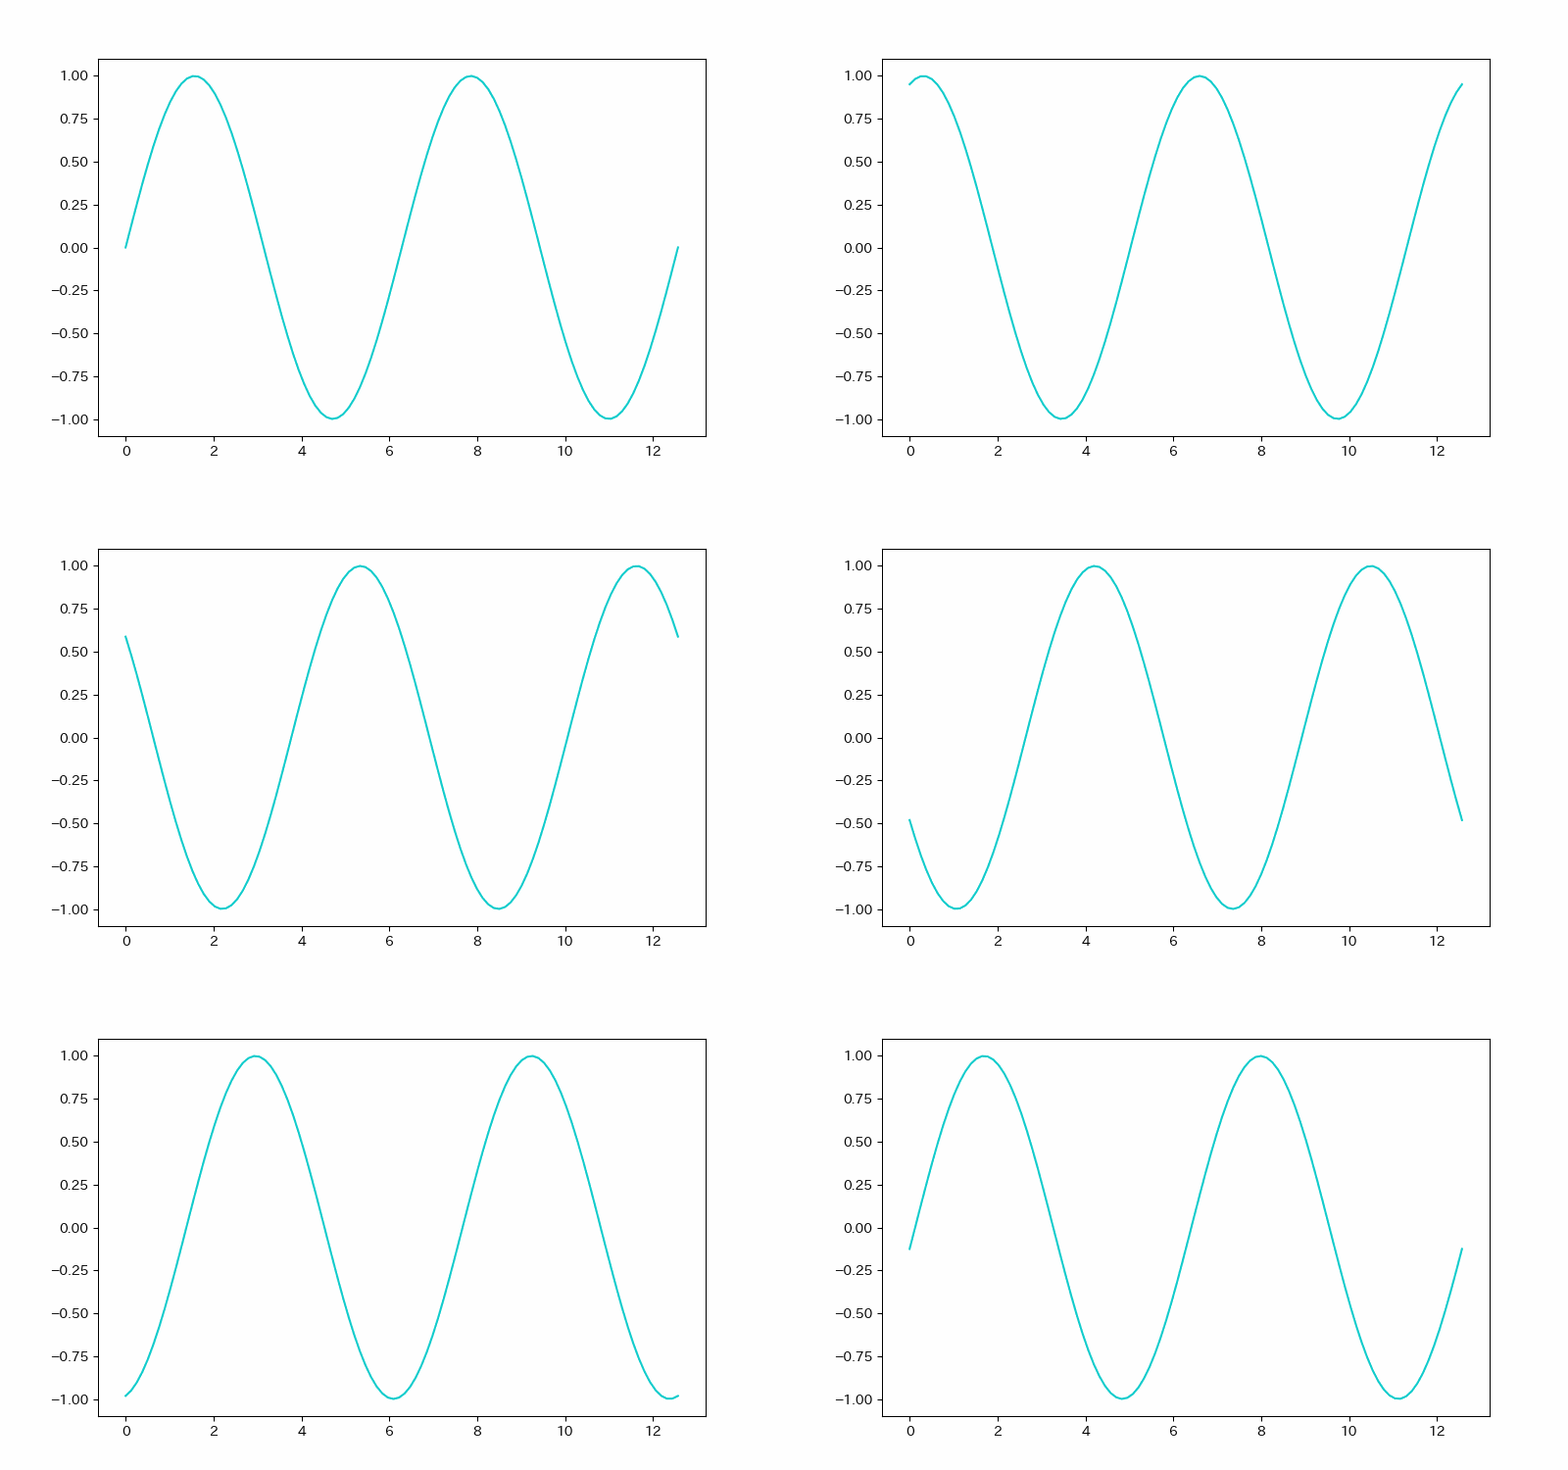
sin


2. 二つのグラフを重ねて描画

サブプロットのオブジェクトを別の変数に分けてグラフを挿入、その後一つの配列にまとめてanimationを用いて描画を行えばグラフが重なって表示される。

copy
plot_anime.py
import numpy as np
import matplotlib.pyplot as plt
import matplotlib.animation as animation

fig = plt.figure(figsize=(8, 5))
ax = fig.add_subplot(111)

lim = 50
xs = np.linspace(0, 4*np.pi, 100)
images = []

for i in range(lim):
    theta = i*2*np.pi/lim
    ys1 = np.sin(xs+theta)
    ys2 = np.cos(xs+theta)
    image1 = ax.plot(xs, ys1, c="#11cccc")
    image2 = ax.plot(xs, ys2, c="#dd8888")

    images.append(image1 + image2)

anime = animation.ArtistAnimation(fig, images, interval=40, blit=True, repeat_delay=0)
anime.save("sin_cos.gif", writer="pillow")
plt.show()


実行結果:
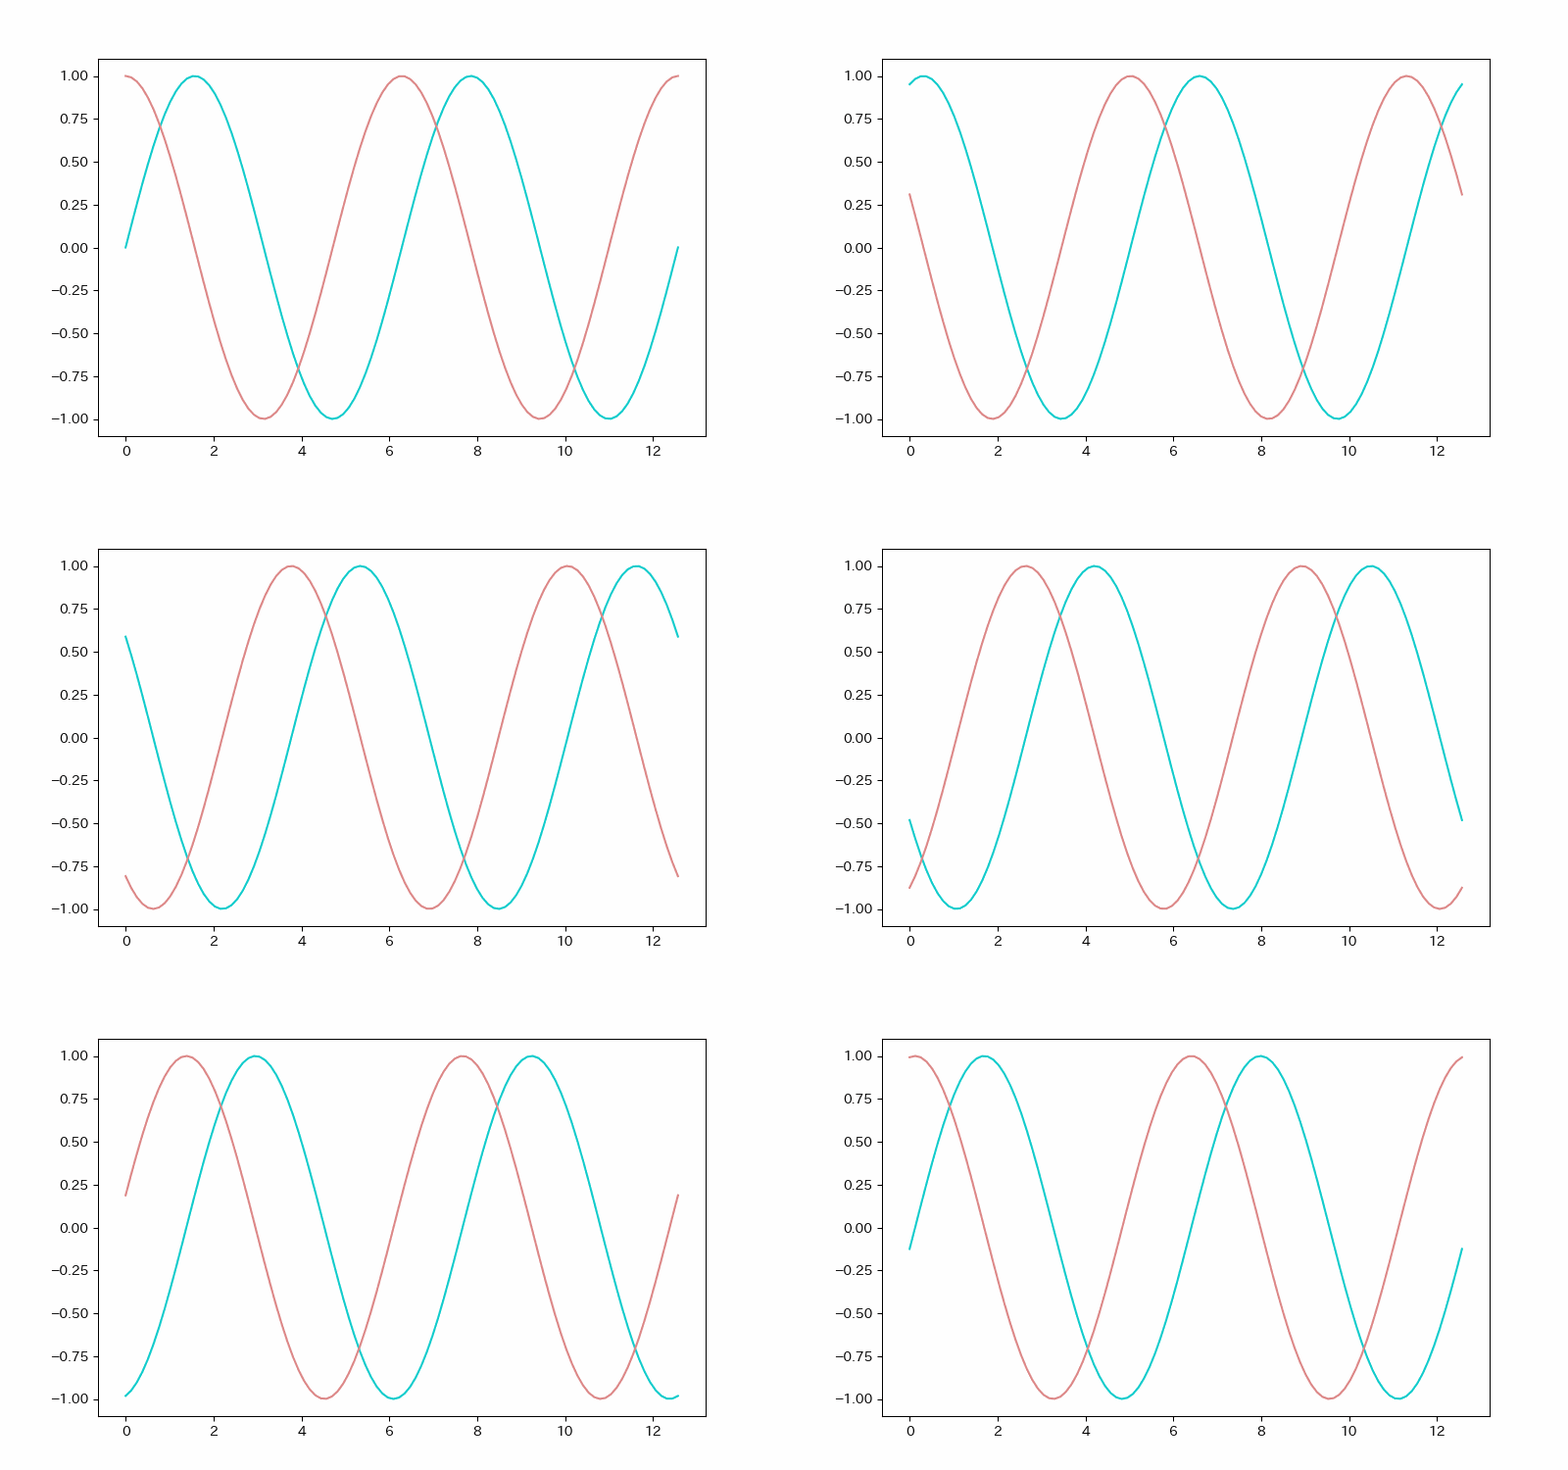
sin


3. おまけ

高校生にsinとcosを説明するときに使えそうなグラフ

copy
sin_cos_anime.py
展開
折り畳む
import numpy as np
import matplotlib.pyplot as plt
import matplotlib.animation as animation


fig = plt.figure(figsize=(10, 10))

# sin
ax1 = fig.add_subplot(2, 2, 1)
plt.title("y = sin(x+t)")
plt.ylabel("y")
plt.xlabel("x")

# cos
ax2 = fig.add_subplot(2, 2, 4)
plt.title("x = cos(y+t)")
plt.ylabel("y")
plt.xlabel("x")

# circle
ax3 = fig.add_subplot(2, 2, 2)
plt.title("0 ≦ r ≦ 1, θ = t")
plt.ylabel("y")
plt.xlabel("x")

# sin, cosの比較
ax4 = fig.add_subplot(2, 2, 3)
plt.title("sinとcosの比較")
plt.ylabel("y")
plt.xlabel("x")


lim: int = 50
images = []
xs = np.linspace(0, 4*np.pi, 50)

for i in range(lim):
    theta = i*2*np.pi/lim

    ys1 = np.sin(xs + theta)
    sin_img = ax1.plot(xs, ys1, c="#11cccc")

    ys2 = np.cos(xs + theta)
    cos_img = ax2.plot(ys2, xs, c="#cccc11")
    
    cos = np.cos(theta)
    sin = np.sin(theta)
    
    xs3 = [0, cos]
    ys3 = [0, sin]
    circle_img = ax3.plot(xs3, ys3, c="#cc11cc")

    xs4 = [cos, cos, -1]
    ys4 = [-1, sin, sin]
    circle_img_2 = ax3.plot(xs4, ys4, c="#cccccc")

    sin_cos_img = ax4.plot(xs, ys1, c="#11cccc")
    sin_cos_img_2 = ax4.plot(xs, ys2, c="#cccc11")

    images.append(sin_img + cos_img + circle_img + circle_img_2 + sin_cos_img + sin_cos_img_2)

anime = animation.ArtistAnimation(fig, images, interval=40, blit=True, repeat_delay=0)
anime.save("sin_cos_2.gif", writer="pillow")
plt.show()


実行結果:
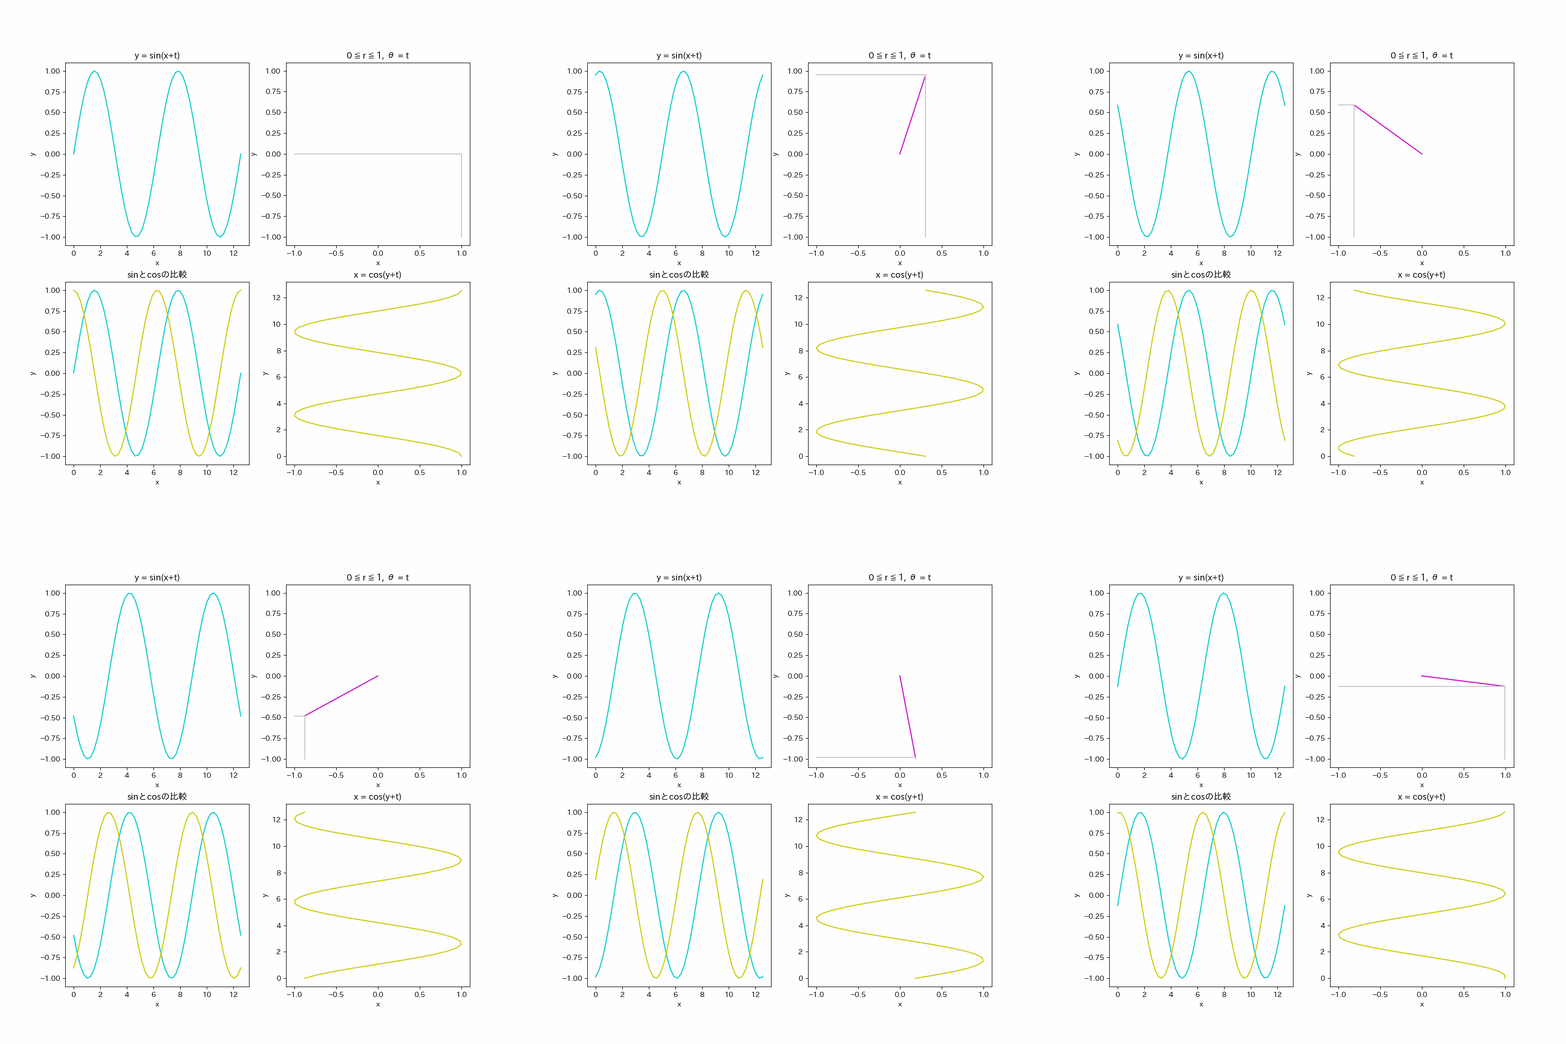
sin